Weblog

A week ago, somebody sent me an e-mail about a memory leak in Hiawatha. I was a bit surprised that someone experienced a memory leak in Hiawatha, because I'm always very keen on memory allocation and use Valgrind during development to make sure I made no mistakes. I haven't experienced memory leaks on my own server and I use most of Hiawatha's features. But later I realized that I often restart Hiawatha, because I do a lot of testing and experimenting. So, if there was a memory leak in Hiawatha, it wouldn't get the chance to grow big on my server. However, on some other servers that I maintain, I saw that Hiawatha was indeed using a lot more memory than wat seemed to be normal. This showed that there is indeed something wrong with Hiawatha's memory usage.
For several days, I've been digging through my code and did severe testing with Valgrind. I even wrote a memory debugger which maps all malloc()-related systems calls to own functions to keep track of memory allocation and freeing. This proved that all memory allocation and freeing in Hiawatha is done correctly. Hiawatha itself is not leaking memory! That left me with the conclusion that one or more libraries that Hiawatha uses is leaking memory, due to a bug in that library or due to incorrect usage by Hiawatha. After a lot of reading and testing, I was almost sure that Hiawatha is using al the libraries correctly. I had done all I could, but still had no idea of the cause of the memory leak.
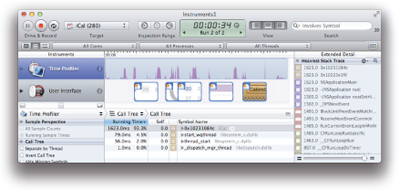
I asked a good friend of mine who helped me before with Hiawatha (pthreads and CMake) to take a look at this issue. He told me to give the Xcode tool Instruments a try. (Everybody doing programming and owning a Mac, give that tool a try! Really!) We used Instruments to keep track of every memory allocation done by Hiawatha or one the the libraries it uses. It showed us that Hiawatha is not leaking memory. However, at the same time we used the command line tool 'ps' to see how much memory Hiawatha uses. It told us that the total amount of Hiawatha's memory usage was growing with every request. Hiawatha started with 3 MB and after about hundred requests it used about 10 MB. But with every test we did, the amount of memory usage at the end was different. So Hiawatha's memory usage was growing while at the same time it was not leaking memory. We were both flabbergasted.
After doing a lot of searching on the Internet, we both found something that most likely explains what's going on here. It seems that when an application deallocates memory via free(), the free'd memory is not returned to the OS, but keeps being assigned to the appliation. Uh... wot? If this is true, and it seems it is, than this means that as a developer you have no control over the amount of memory usage of your application. We found this hard to believe, so we searched some more for how to actually release free'd memory, to give free'd memory back to the operating system. We couldn't find anything. I already tried memory_trim(), but that doesn't make any difference.
Anybody out there who has experience with this? Is this something that can be solved or should it be ignored? Any advice or tips are welcome!
Update: there is a discussion at Reddit about this article.
Built upon the Banshee PHP framework.

Refer to your weblog related to memory leak on Hiawatha.
The following is quoted from "Determining free memory on Linux" at http://blog.scoutapp.com/articles/2010/10/06/determining-free-memory-on-linux
Reading data from a disk is far slower than accessing data from memory. Linux caches blocks from the disk in memory. In fact, Linux uses all free RAM for the buffer cache to make reading data as efficient as possible.
What happens if a program needs more memory than what’s available? The buffer cache will shrink to accommodate the increased memory needs. The buffer cache works like your most efficient coworker: when things aren’t busy, he runs around making things run smoother. When an important task comes up, he drops the less important chores.
The following link is talking about the memory management on Linux :
http://www.tldp.org/LDP/tlk/mm/memory.html
If you want to free the memory in Linux, you can :
http://www.commandlinefu.com/commands/view/2888/release-memory-used-by-the-linux-kernel-on-caches
Hope this may help.
Samiux
Did you also tried to compile Hiawatha with a different C standard library?
Those are parts which are also made by humans. It's not to put the blame on any of the developers, but overseeing an error is human.
Can you explain your test setup to push 100K connections simultaneously?
You can email me at md at rpzdesign dot com as I would like to have an offline discussion.
Your response appreciated,
Marco
San Isidro de General
Costa Rica
The bottom line is that for a long-running application such as Hiawatha, memory fragmentation could be a problem unless the library handles it. I know that GNU malloc tries to avoid this, but I still prefer to manage my own free lists. If I have a 48-byte widget and a 4096-byte page size, then I'll never malloc 48 bytes. I'll malloc (int) 4096 / 48 bytes as an array, and chain them all together on a free list. And then use that list as the basis for what I obtain and free.
If I need a big widget, I try to allocate just one.
If I need a widget I'll never need again, I might use malloc and free.
Marc
I just send you an mail, hope it helps.
To address Marco's question, most of what I did while testing Hiawatha at scale applies to scaling any network application. Simple systems stuff like making sure you have enough free sockets (I had to plumb two interfaces to support that many at once), that your network will support that many simultaneous connections from end to end, setting the ulimit values for the busy daemons to make sure they don't get choked by system policies, etc. The hardest part wasn't scaling Hiawatha, but generating enough test traffic without overwhelming the scripting languages most tools are written in. If you need more specific pointers, feel free to email me and we can take it offline: cwadge at gmail dot com.
1. I assume this article might do the trick for you. This is common for apps on a Linux/Unix system. However the memory usage should be 'real' to the applications but 'seems unreal' to the OS tools. I once learned of a way by using syscalls to get real memory usage but could not find a suitable thread asap.
http://unix.stackexchange.com/questions/14102/real-memory-usage
2. Could it be www.musl-libc.org could be of interest to the hiawatha project ?
Thanks again
Every ~400 times, the device seemed to leak around 28 Kbytes, but what actually happened was that Hiawatha - for each connection attempt - added 70 bytes of text ("10.10.137.1|Thu 01 Jan 1970 00:19:02 +0000|Silent client disconnected") to its system log file, which by default is located in /var/log/system.log.
Since /var/log is a ramfs on our device, the memory slowly disappeared. The fix was to change hiawatha.conf to have SystemLogfile, GarbageLogfile and ErrorLogfile point to /dev/null (and AccessLogfile be "none").