Weblog

Although the Hiawatha Monitor is available for more than 5 years (since Hiawatha v7.0), I think not many people actually use it. I'm not sure about the exact reason for that, but it might very well be that people don't understand the purpose or usefulness of this tool. Therefor, I'll explain in this weblog post what the Hiawatha Monitor can do for you.
While the main focus of the Hiawatha webserver is security, the Monitor's focus is more than that. Of course it includes security, but it's also about performance, availability and detecting errors. Via graphs with statistical information, you can have a quick view on what's going on at your webserver and which one needs attention. The purpose of the Monitor isn't to give you detailed information about what's going, but to simply give you enough pointers to start your investigation. You will know in what logfile you should start reading. For example, if the average amount of traffic for a certain website is usually between 300 and 400 megabytes and suddenly it generates 2 GB of traffic, you might want to check the access logfile for that website. The screenshot below shows that peak in traffic for a certain webserver.
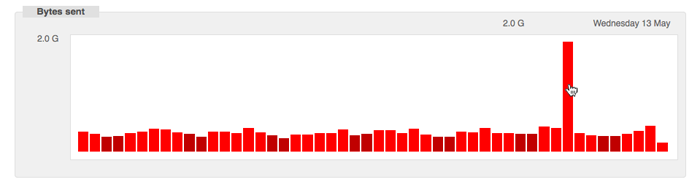
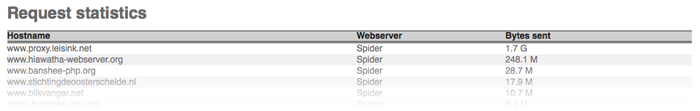
By clicking on the bar, you get an overview of which website is responsible for what part of that amount of traffic, sorted by the amount. The one on top is most likely the one you should investigate.
In this example, the traffic peak was caused by my own web proxy, which I was developing at that moment. But it could also be someone downloading a large file from your website (should that file be there?) or your website was mentioned at another website (check Referer headers).
Amount of traffic is just one thing the Hiawatha Monitor shows you. It also shows you 404 errors (Not Found), which might indicate a dead link in one of your websites or 500 errors (Internal Server Error), which might indicate, for example, an error in one of your CGI scripts. CGI scripts might generate an error message or a warning, while the output was just fine. You won't see anything wrong at your website, while the error logfile grows larger and larger. The CGI errors graph at the CGI statistics section shows you that.
Hiawatha automatically reports failed logins for HTTP authentication, but failed logins for login functionality in your CGI scripts can also be monitored by printing the HTTP header X-Hiawatha-Monitor with the value 'failed_login'. The same goes for exploit attempts by using the value 'exploit_attempt'. Of course, don't forget to print detailed information about the exploit attempt to stderr for in your error logfile.
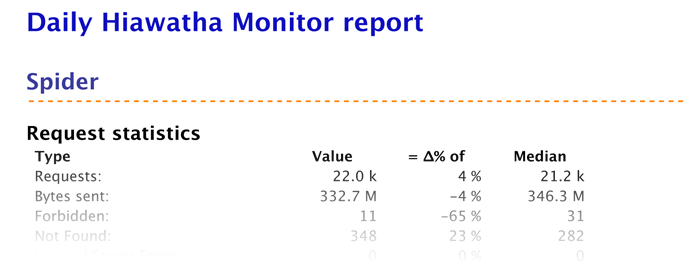
To make monitoring your Hiawatha webservers as easy as possible, the Monitor is also able to send you a daily report about the previous day. In one e-mail you get an easy overview about any significant changes in behavior and performance between yesterday and the last two weeks.
As you can see, the Hiawatha Monitor has a lot to offer in aiding you in maintaining your websites and webservers. Although I've told a lot about what I can do for you, there's much more to discover, like runtime of CGI scripts, checking if your webservers are up to date or messages from a CGI script directly to the Monitor. If you have multiple Hiawatha webservers running or just one, but with multiple websites, I'm very sure the Hiawatha Monitor will be a valuable tool.
Built upon the Banshee PHP framework.

"PHP Notice: Use of undefined constant parent - assumed 'parent' in /home/hmonitor/libraries/graph_model.php on line 12".
"59 23 * * * /path/to/monitor/website/database/send_reports".
I'll take a look at the undefined index message. Add a 'error_reporting(E_ALL & ~E_NOTICE);' at the start of the script as a work-around.
And as per your guess for some it could be lack of awareness (why don't you have the monitor's screen shot on the download page itself and a separate section on the download page for it just below the main download, moving the 'License' section to further bottom)
I really like it. When I start to run my site, I will really use the monitor (no need to install other log programs like webalizer and manually missing to view them time to time)
As for the Monitor i don't think that it's usage is similar to other stats scripts. I like it cause it show me errors(cgi, not found) and the most important for me, exploit attempts, failed logins and events. Check your events in case you run a joomla or wordpress site and you will understand me.
Having to install (and run) another SQL database just for the Hiawatha Monitor is just too much. Now, if you supported different SQL database servers, or would just support sqlite that would make it much easier to use.
A lot of tools are available to convert MySQL databases to PostgreSQL, for example this one [github.com].
It shouldn't be too hard to make it work. I'll think about supporting it by default in future releases, but no promises yet.
The script you linked requires you to have the database running in MySQL, BTW, to do a more 'compatible' dump. Other scripts seem even harder to use, and I don't even want to think of the trouble differences in variable type will spell.
MySQL was never know to place nice with others. Compatibility between Oracle and PostgreSQL is a lot better, IIRC, which is rather ironic, considering.
First problem is, I dont know if monitor is part of debian package. Compiled it extra with monitor. Still doesnt work.
If monitor and webserver are on same machine, I think IP 127.0.0.1 should work.
Its unclear, what to fill out in websites: only the servers were hiawatha is running or every virtual website?
"Hostname administration" is unclear too. If I push "Update hostnames" I get "» Error while updating hostname visibility."
Too many open questions for me ...